Data Analyst and Power BI Developer focused on dashboards, reporting systems, and decision-ready insights through Power BI, SQL, and data storytelling.

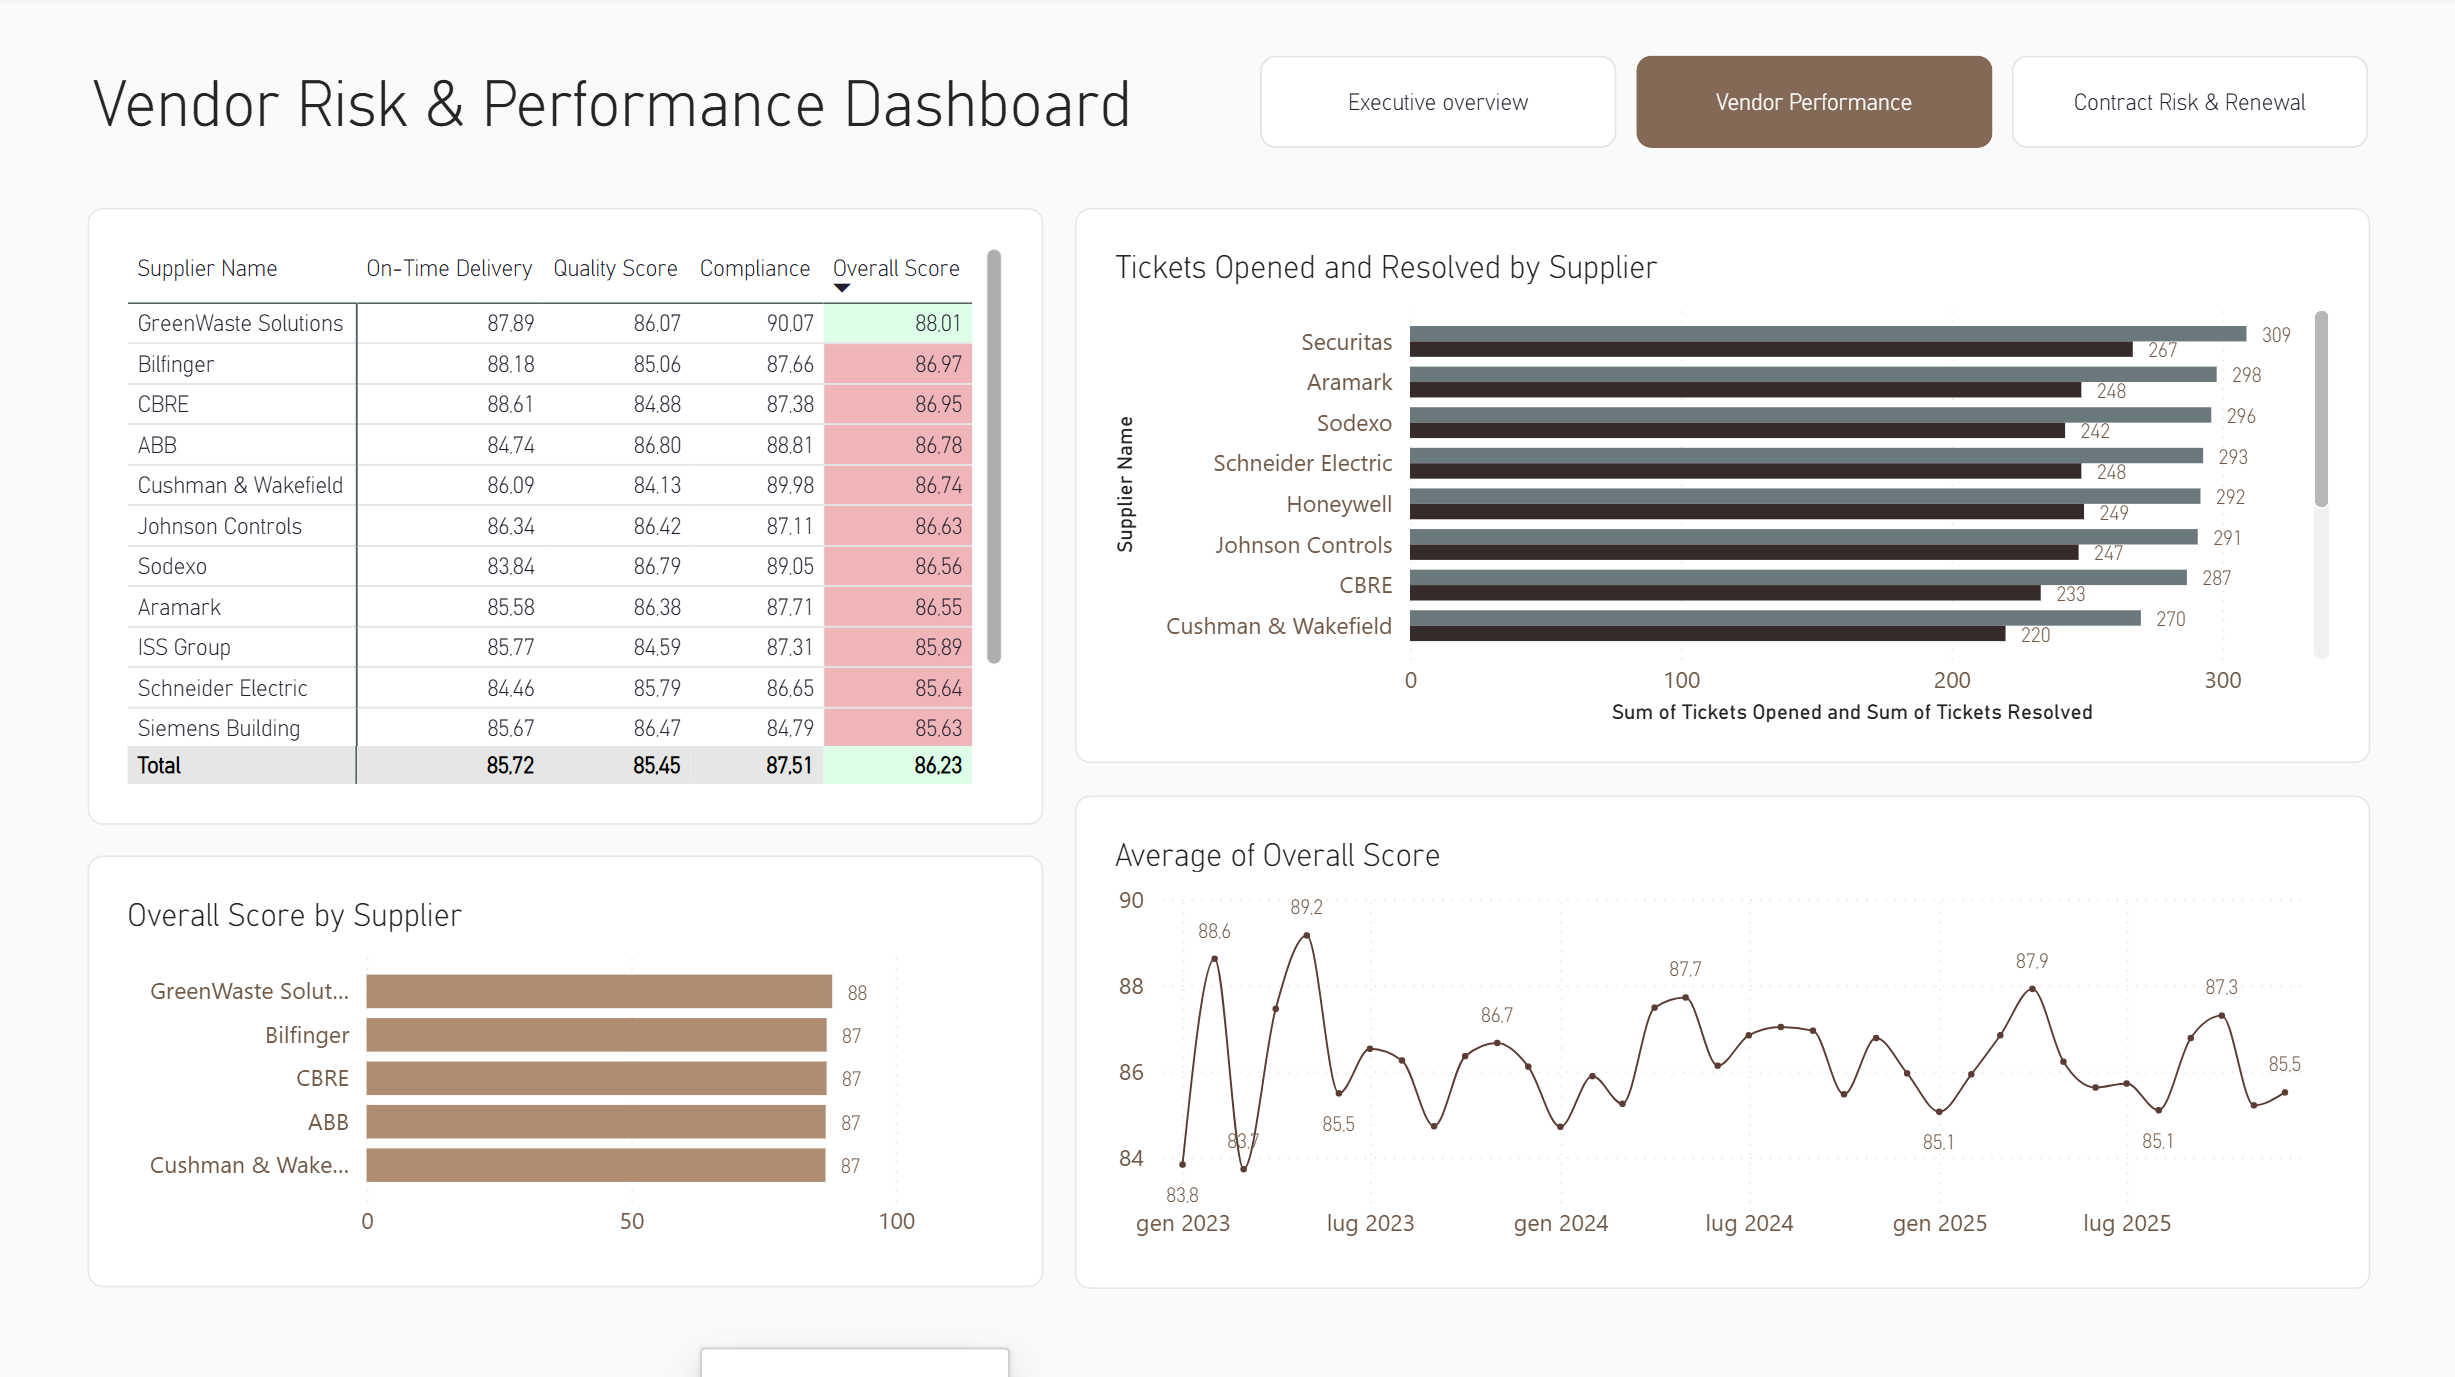
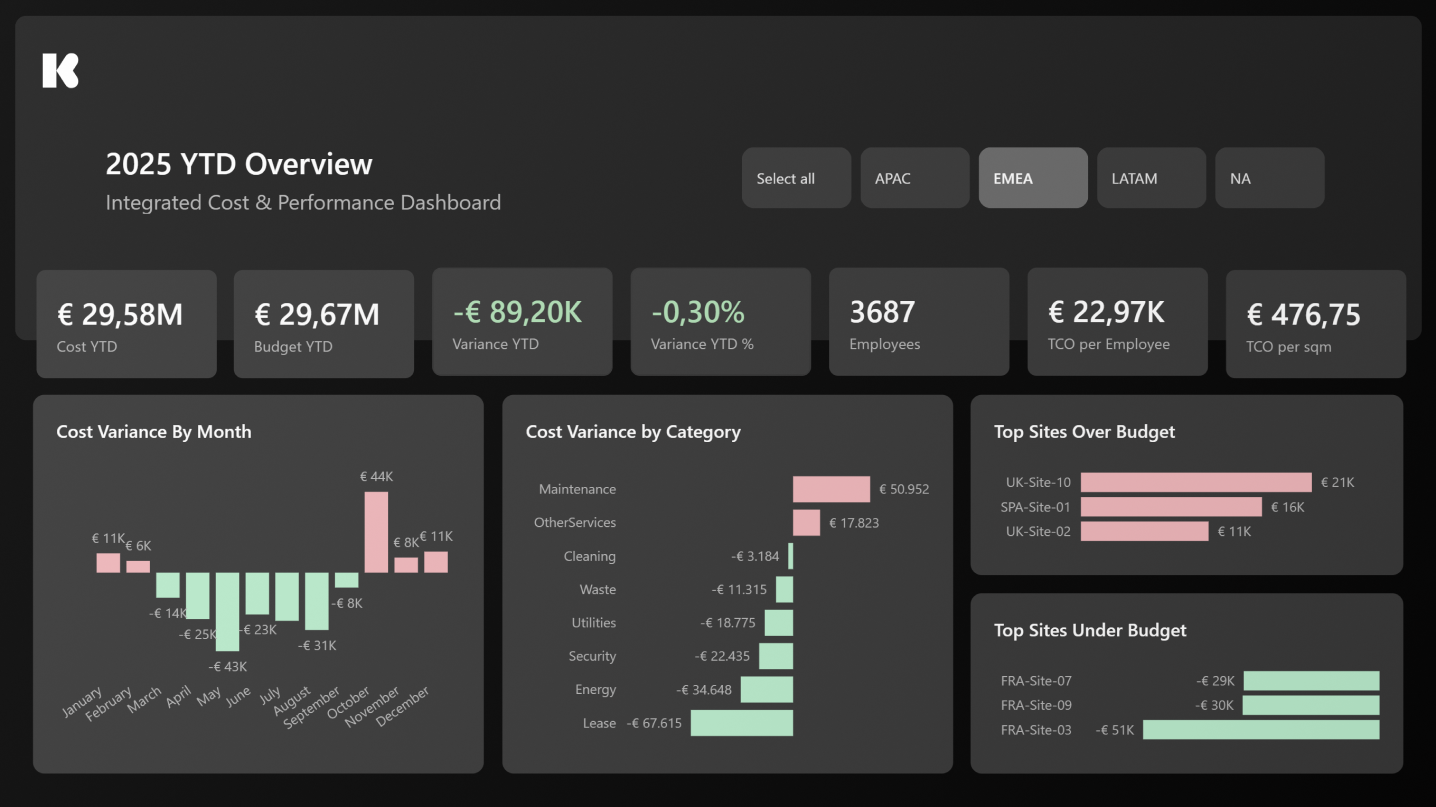
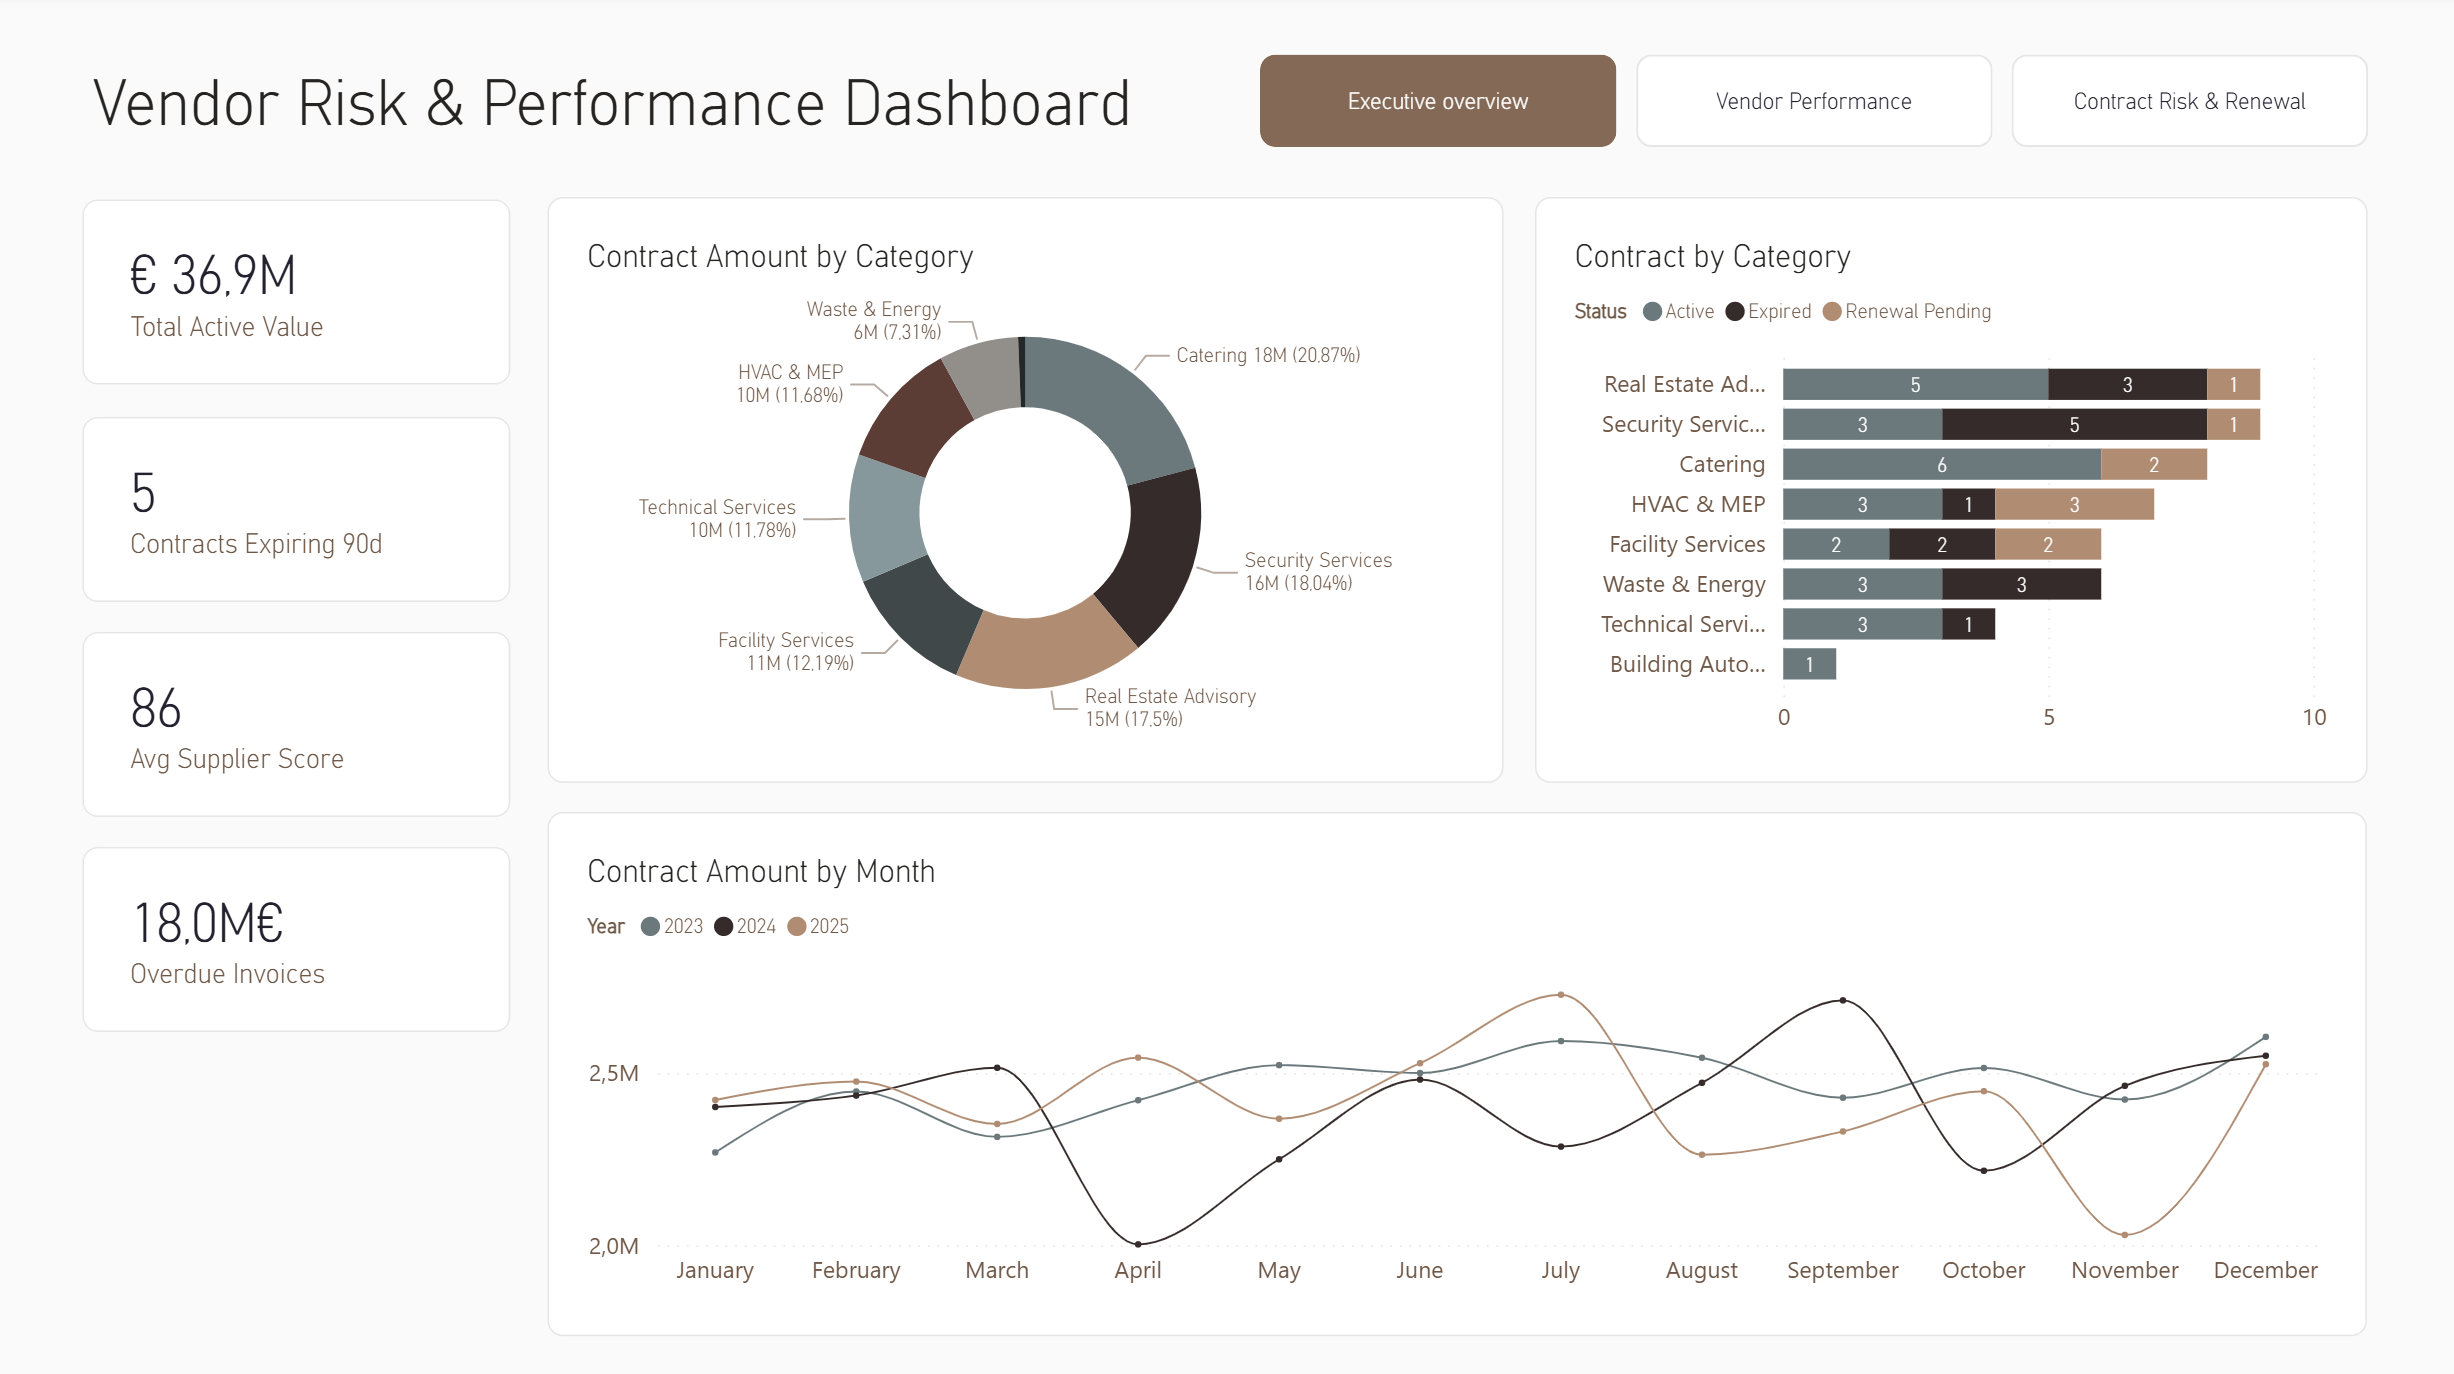
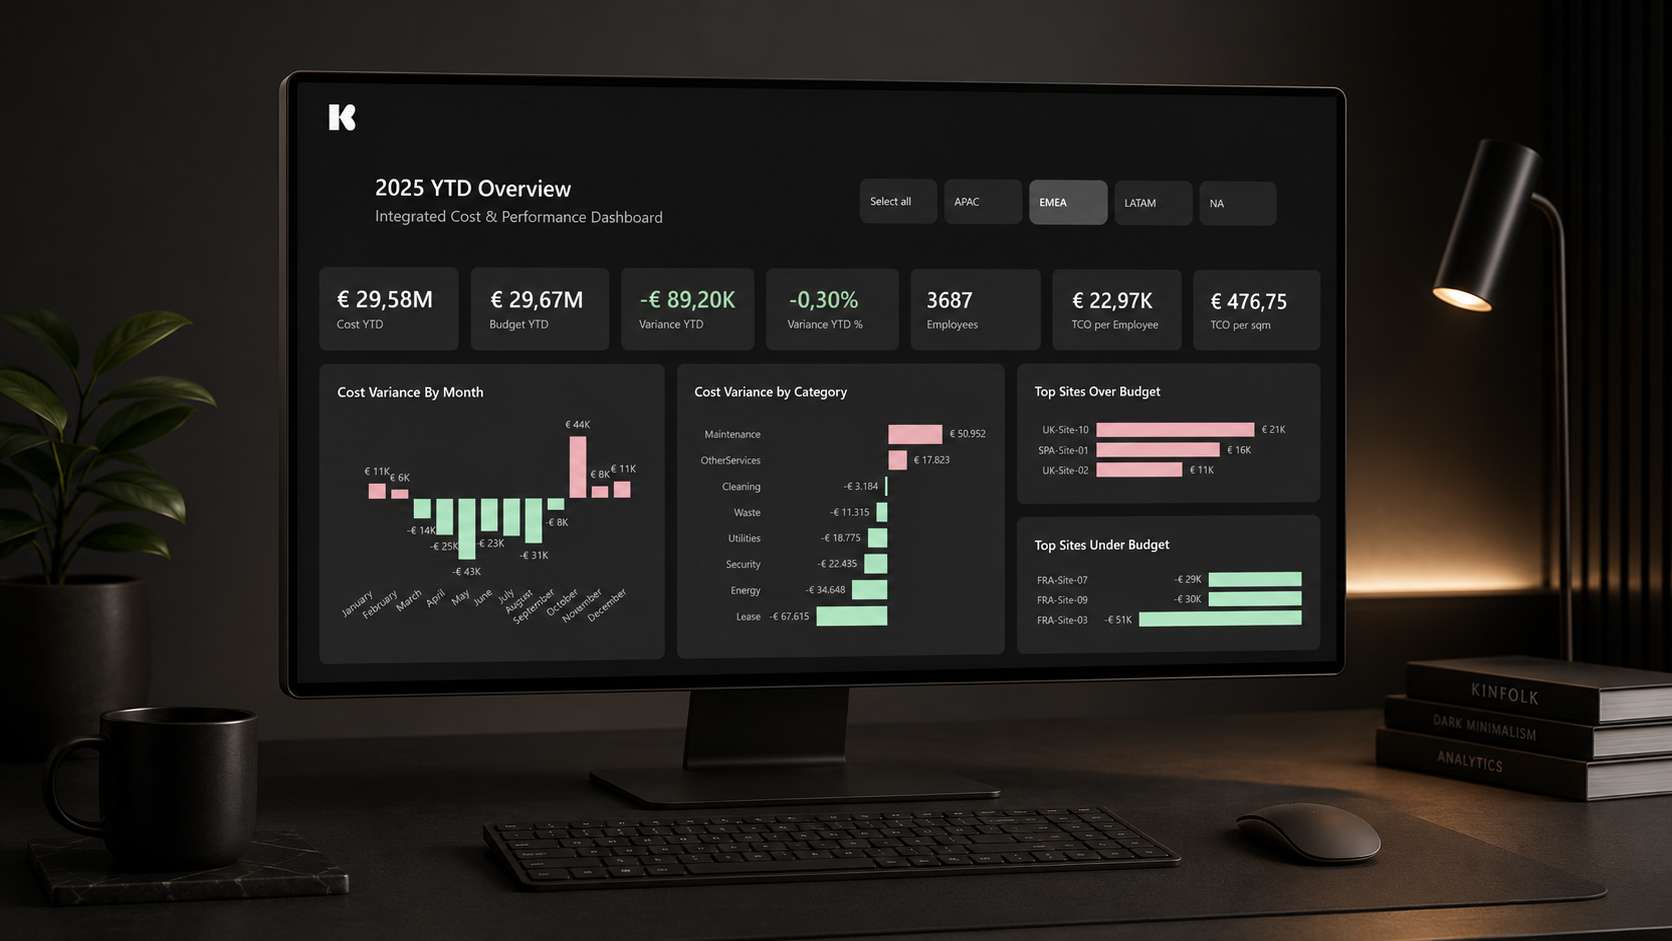
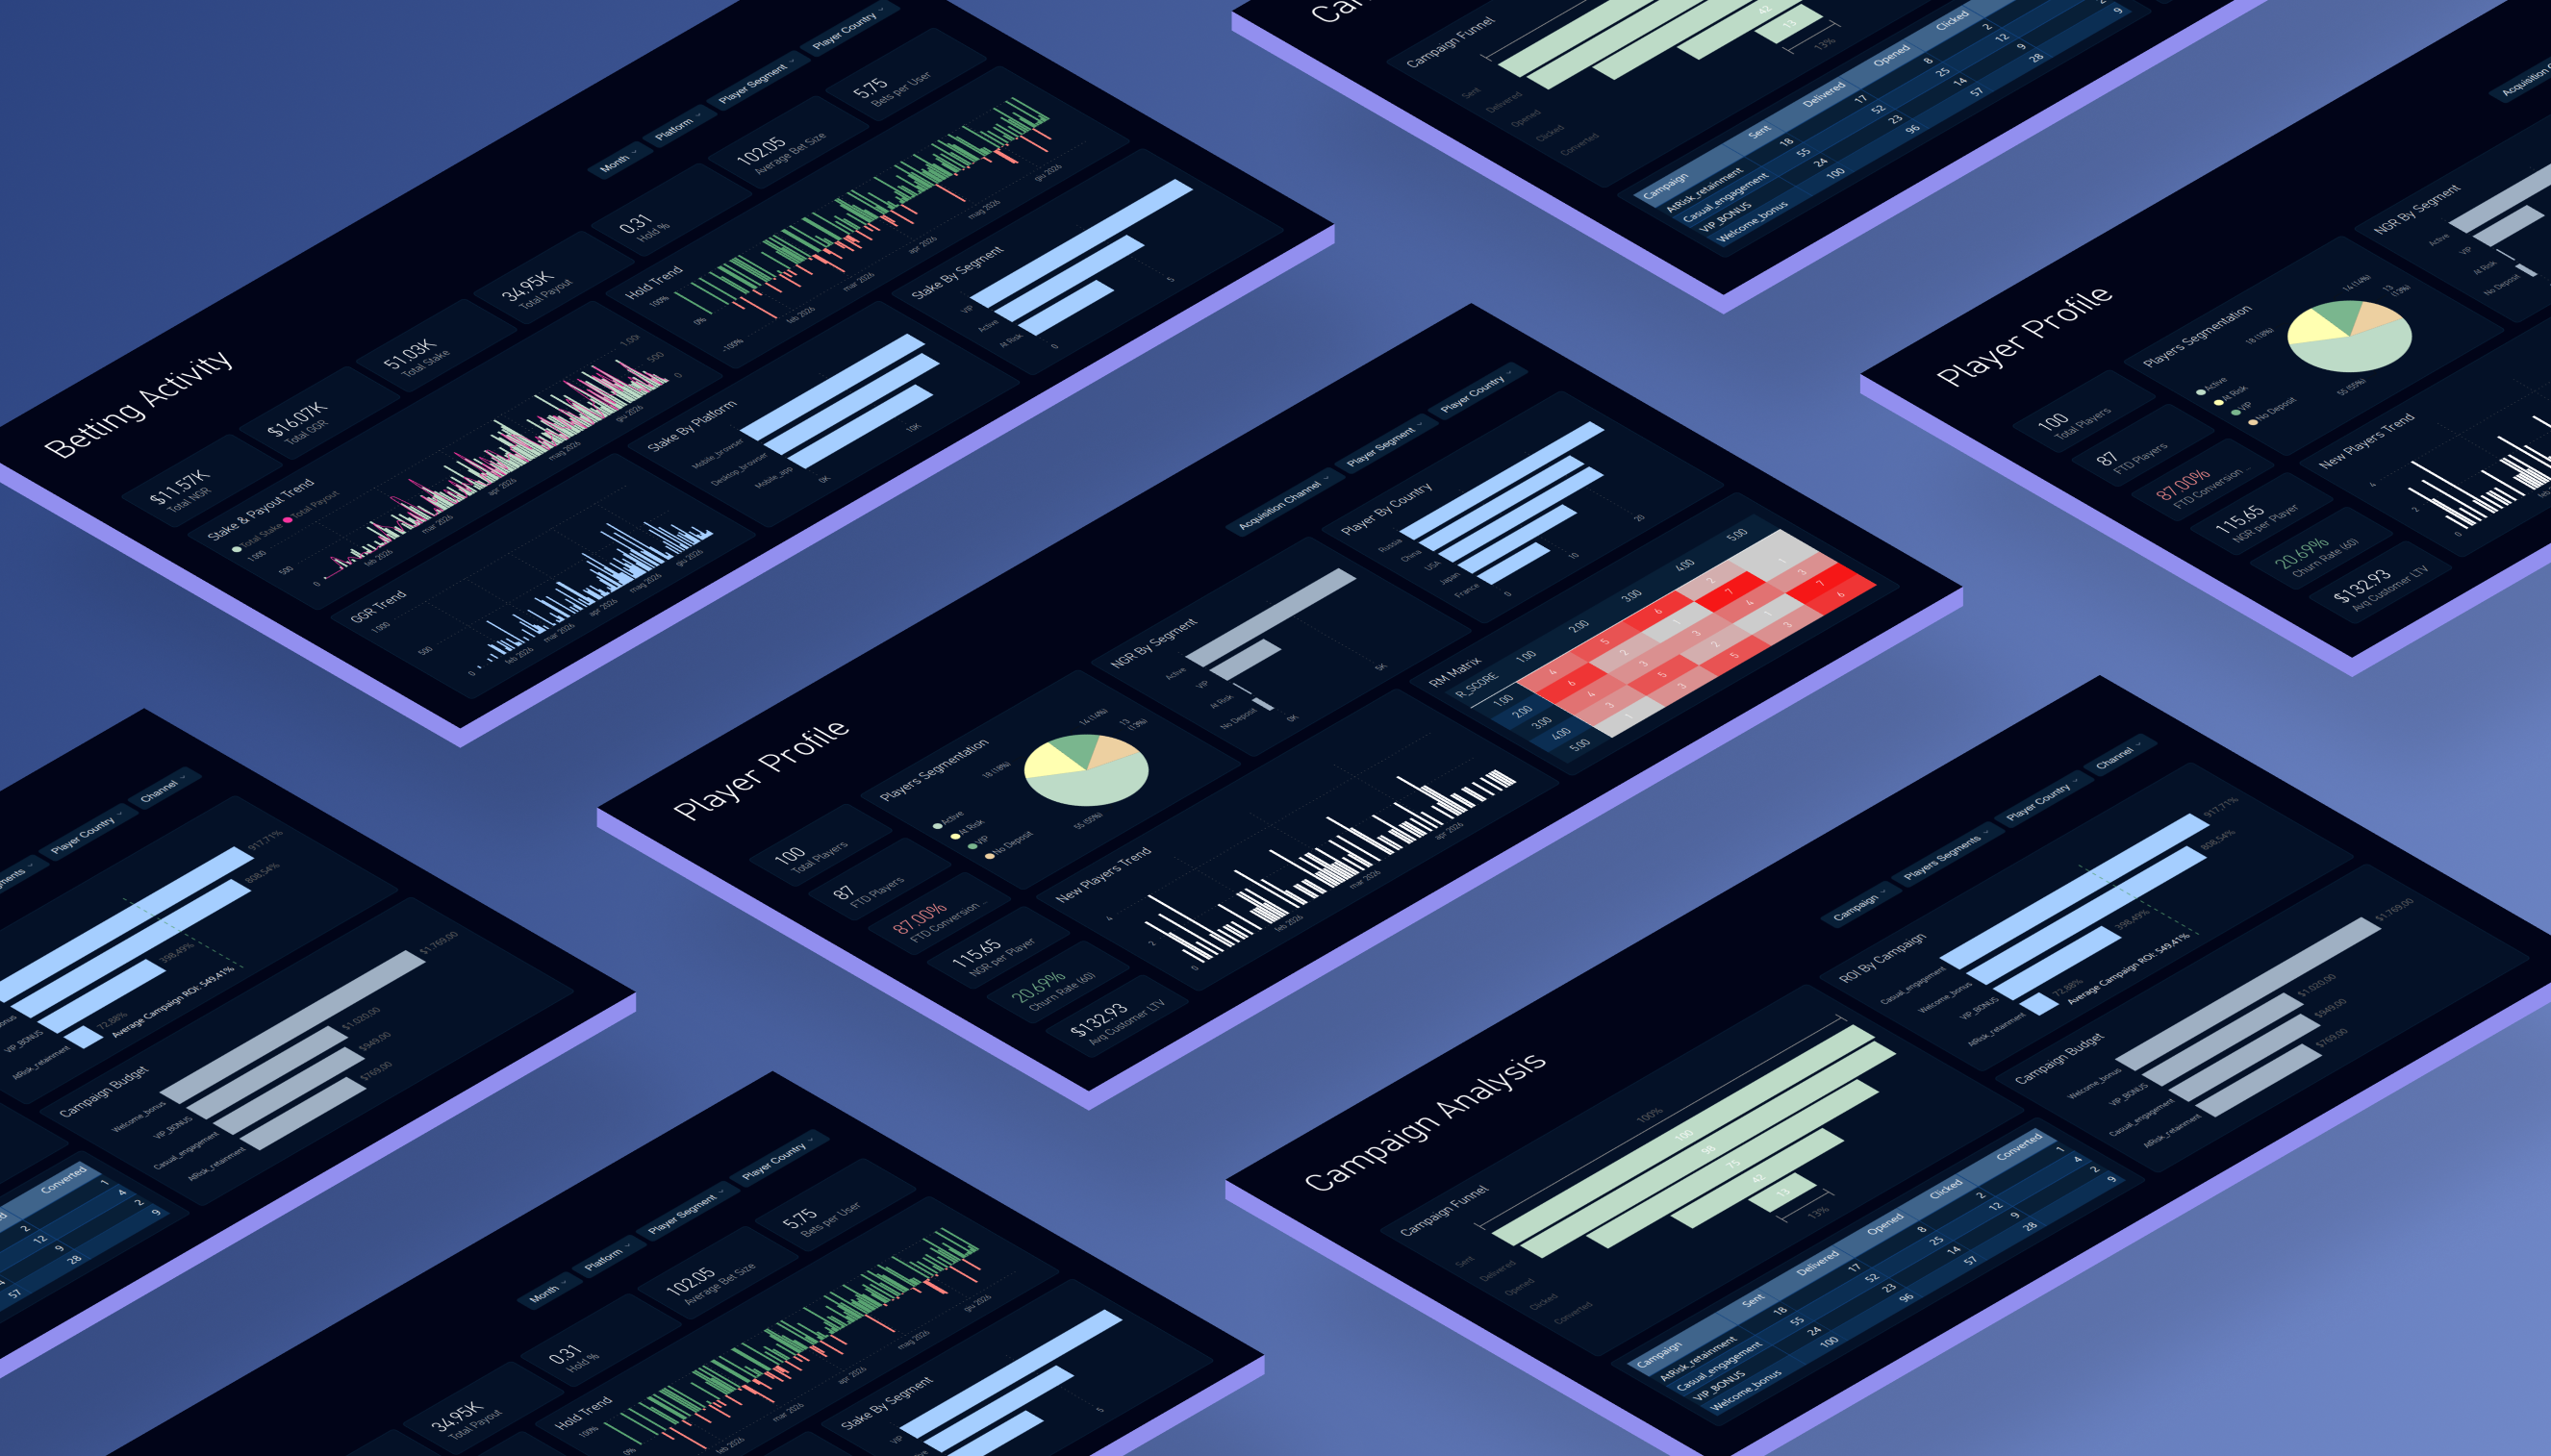
I design Power BI dashboards and reporting systems that help teams monitor performance, track KPIs, and make more confident decisions.

Structured querying and data analysis to support consistent, trustworthy decision-making.

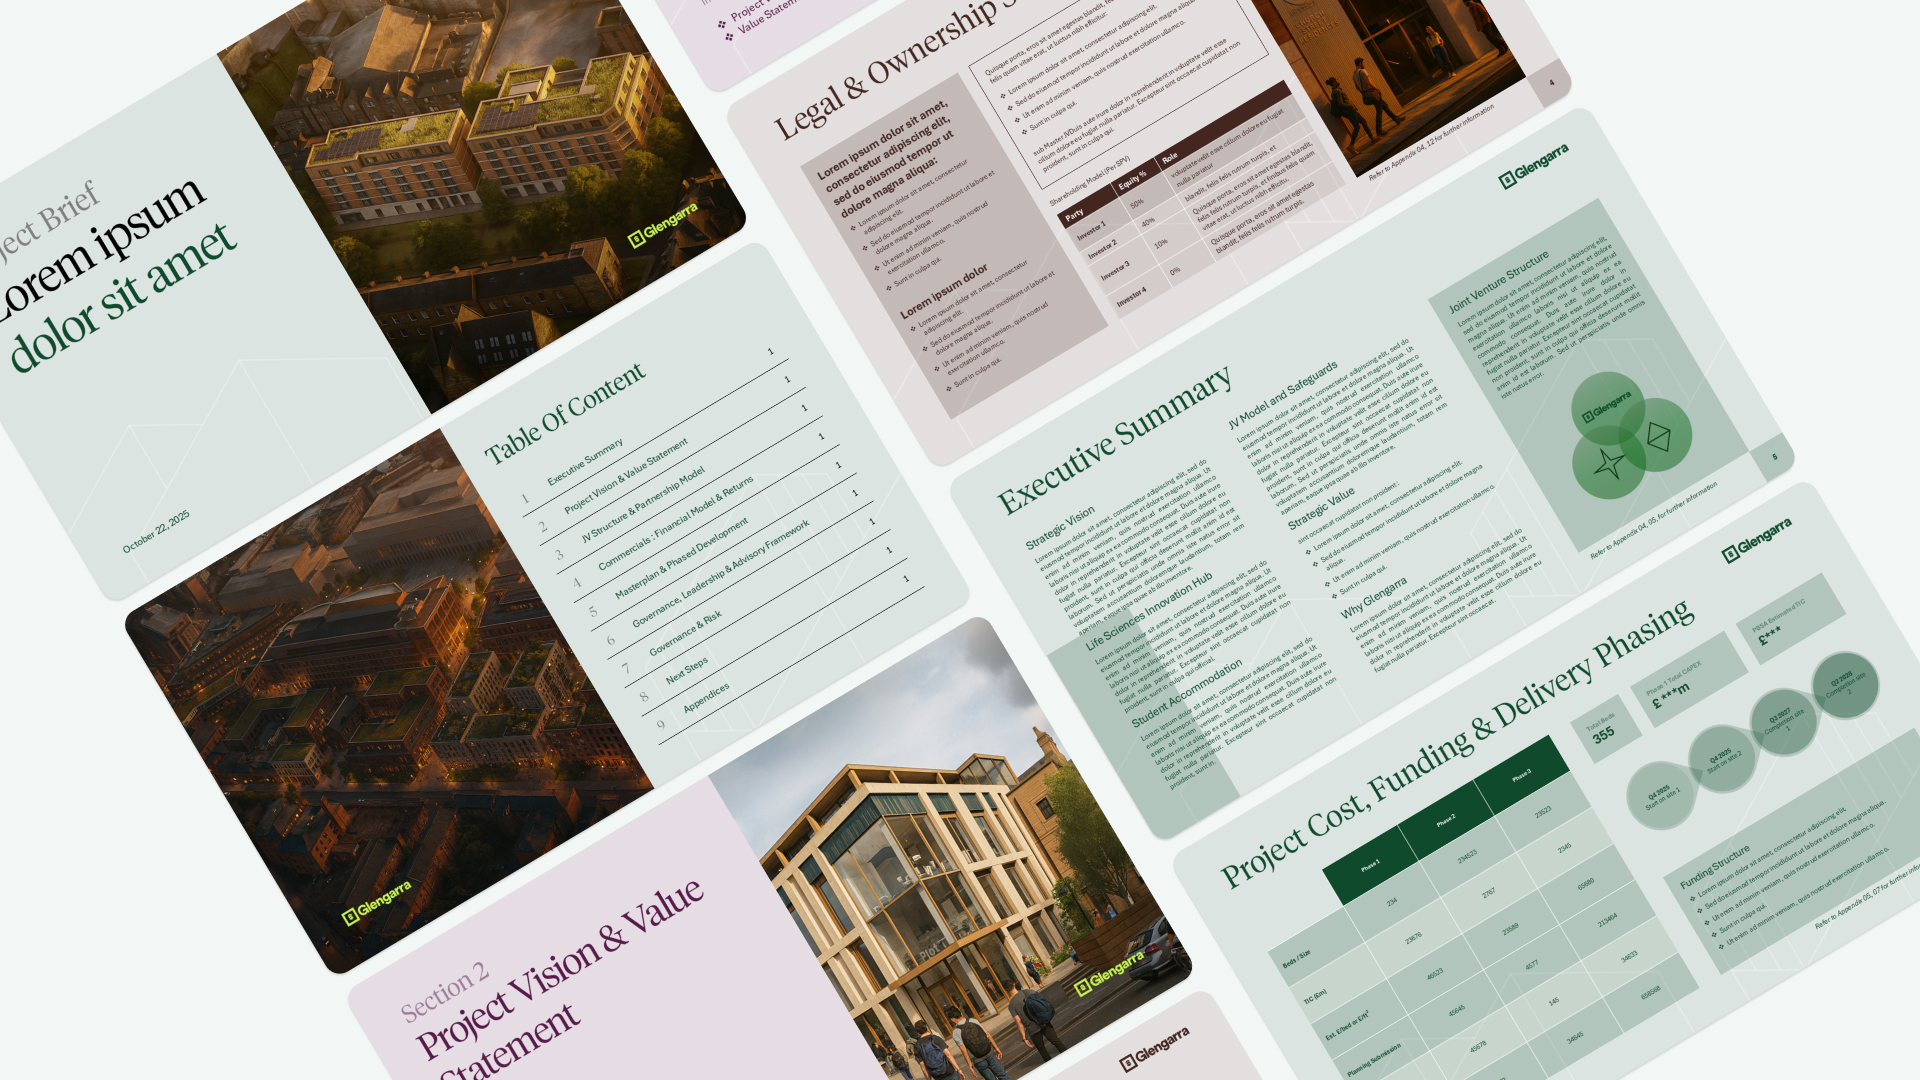
Executive-ready reporting and presentations designed to communicate insights with clarity and impact.

I help companies transform fragmented data into clear, reliable, and decision-ready reporting solutions. From Power BI dashboards and KPI frameworks to executive presentations and performance analysis, my approach combines analytical thinking, business understanding, and strong visual communication. The result is reporting that is not only accurate, but also easy to use, easy to understand, and built to support better decisions.


Clear data leads to better decisions. My data visualization transforms numbers into immediate insights, giving you the speed and confidence needed to grow and win.
Increase in decision-making efficiency for teams that use data visualization tools.
The Power of Data Visualization: Insights, Tools, & Best Practices
Reduction in average meeting time for teams that utilize data visualization tools.
The Power of Data Visualization: Insights, Tools, & Best Practices
Return on investment over 3 years for companies using Power BI as a data visualization tool.
Total Economic Impact™" (TEI), condotto da Forrester Consulting
Have an idea or a challenge to solve? Tell me about it, and I'll personally get back to you.